Insulin in Blood: Normal Levels, HOMA-IR and Insulin Resistance
Reviewed by the LabReadAI medical team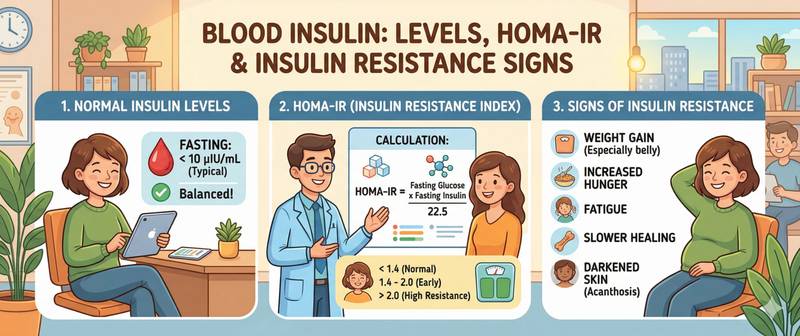
Most people think of insulin only in the context of diabetes. But long before diabetes develops, insulin starts sending signals: it rises and remains chronically elevated — and this pattern is called insulin resistance. The pancreas presses harder and harder on the accelerator to keep blood sugar in range, while tissues respond less and less to its efforts. Fasting insulin combined with glucose is the most accessible way to see this process at an early stage, when lifestyle changes can still reverse the course.
What Is Insulin and Why Is It Measured
Insulin is a polypeptide hormone produced by the beta cells of the pancreas. Its primary biological role is to open "gates" in muscle, adipose and liver cells for glucose entry after a meal. Think of insulin as a key and cell-surface receptors as locks. In a healthy state, one turn of the key — and glucose is inside, the cell gets energy, blood sugar falls.
In insulin resistance, the locks start to jam: the key inserts but the door barely opens. The pancreas responds logically — it makes more keys. Insulin levels in the blood rise (hyperinsulinaemia), and for a time this compensates for reduced tissue sensitivity. Blood glucose remains normal throughout — which is precisely why a standard blood sugar test shows nothing, while insulin has been elevated for years.
This explains the main clinical value of measuring insulin: it detects metabolic dysfunction at the stage when glucose has not yet exceeded the normal range. The window for intervention sits here.
Beyond diagnosing insulin resistance, an insulin test is used for differential diagnosis of hypoglycaemia (suspected insulinoma), assessment of beta-cell function in type 1 and type 2 diabetes, and in the work-up for PCOS and fertility disturbances.
Normal Insulin Levels in Blood
| Measure | Normal range |
|---|---|
| Fasting insulin (adults) | 2.6–24.9 µIU/mL |
| Fasting insulin (optimal range) | 3–10 µIU/mL |
| Fasting insulin (children) | 2.0–20.0 µIU/mL |
| HOMA-IR (normal) | < 2.5 |
| HOMA-IR (insulin resistance) | ≥ 2.7–3.0 |
Reference values depend on the assay method and laboratory. Always use the norms printed on your own lab report.
Several clinically important nuances:
"Normal" vs "optimal" insulin. A result of 20–24 µIU/mL technically falls within the laboratory reference range. Clinically, however, such a level in someone with obesity, irregular cycles or post-meal fatigue already signals significant hyperinsulinaemia. This is why the functional optimum of 3–10 µIU/mL is far more informative than the formal "up to 24" as a target benchmark.
Insulin in pregnancy. Physiological insulin resistance develops normally during pregnancy — an evolutionary mechanism that ensures the placenta and foetus receive adequate glucose. Insulin in pregnant women must be interpreted with this context in mind.
Adolescents. Puberty is accompanied by transient insulin resistance — a normal physiological process related to growth hormone.
How to Prepare for an Insulin Blood Test
Insulin is one of the most sampling-sensitive laboratory markers. A single protocol violation can render the result entirely unreliable.
Strict fasting — at least 12 hours. Even a small meal, a milky coffee or a sugary drink triggers a sharp insulin surge. Two hours after eating, insulin in a healthy person can be 5–10 times higher than fasting. This rule is absolute.
The evening before the test. Last meal — a light dinner no later than 8 pm. A fatty meal the previous evening can produce a prolonged insulin response extending to the following morning.
Physical exercise. Intense training within 24 hours before the test lowers insulin via insulin-independent muscle glucose uptake. This falsely reduces the result. Moderate activity has no significant effect.
Stress. Acute stress and anxiety raise glucose via cortisol → insulin rises reflexively. Sit quietly for 10–15 minutes before the blood draw.
Medications. Metformin lowers insulin (this is its mechanism of action). Corticosteroids, thiazide diuretics and some antipsychotics raise it. Inform the physician about all medications.
Always test with glucose simultaneously. Insulin without glucose is half the information: only their combination allows HOMA-IR to be calculated.
Elevated Insulin: Causes
Chronically elevated fasting insulin is one of the most common yet least frequently diagnosed metabolic disturbances. Many people live with hyperinsulinaemia for years without knowing it.
| Cause | Mechanism | Features |
|---|---|---|
| Insulin resistance / obesity | Reduced receptor sensitivity → compensatory hypersecretion | Most common cause; glucose often remains normal |
| PCOS | Insulin resistance in 65–70% of patients → hyperinsulinaemia stimulates ovarian androgen production | A key pathogenetic mechanism — more detail at PCOS |
| Metabolic syndrome | Shared mechanism with IR; visceral fat → free fatty acids → impaired insulin signalling | Combined with dyslipidaemia and hypertension — at metabolic syndrome |
| Prediabetes | Beta cells compensate for reduced sensitivity by overproduction; insulin high, glucose at the upper limit of normal | Intermediate state before manifest diabetes |
| Insulinoma | Beta-cell tumour secreting insulin autonomously | Rare but important: high insulin + low glucose |
| Cushing's syndrome | Hypercortisolaemia reduces tissue insulin sensitivity | Combined with characteristic fat redistribution and hypertension |
| Acromegaly | Excess growth hormone antagonises insulin | Combined with acral enlargement |
| Certain medications | Corticosteroids, atypical antipsychotics, nicotinic acid | Iatrogenic hyperinsulinaemia |
Symptoms of chronic hyperinsulinaemia — the ones that are easily attributed to tiredness or poor diet: intense craving for sweets and carbohydrates 1–2 hours after eating, post-meal sleepiness, abdominal weight gain despite moderate intake, difficulty losing weight, dark velvety patches in skin folds (acanthosis nigricans).
Low Insulin: Causes
Persistently low or undetectable fasting insulin is a direct indicator of beta-cell dysfunction.
- Type 1 diabetes mellitus — autoimmune destruction of beta cells; insulin falls to zero; lifelong insulin therapy required
- Latent autoimmune diabetes in adults (LADA) — slowly progressive autoimmune diabetes; clinically indistinguishable from type 2 diabetes early on, but insulin progressively falls
- Pancreatogenic diabetes — in severe chronic pancreatitis or after pancreatic resection, destruction of acinar tissue also involves the islets of Langerhans
- Prolonged fasting — physiologically low insulin; not pathological
- Intense physical exercise — transient reduction via increased muscle insulin sensitivity
Low insulin with high glucose is always an alarming combination requiring immediate medical attention.
Insulin and Glucose: The HOMA-IR Index
HOMA-IR (Homeostatic Model Assessment of Insulin Resistance) is the standardised index for insulin resistance assessment in outpatient practice. It is calculated as follows:
HOMA-IR = (fasting insulin, µIU/mL × fasting glucose, mmol/L) ÷ 22.5
Example: insulin 14 µIU/mL, glucose 5.4 mmol/L → HOMA-IR = (14 × 5.4) / 22.5 = 3.36 → insulin resistance.
| HOMA-IR | Interpretation |
|---|---|
| < 1.0 | Excellent insulin sensitivity |
| 1.0–2.5 | Normal for most adults |
| 2.5–3.0 | Borderline — elevated risk |
| > 3.0 | Insulin resistance |
| > 5.0 | Marked insulin resistance |
Threshold values vary across studies. Some laboratories and clinical guidelines use HOMA-IR ≥ 2.7 as the insulin resistance threshold.
HOMA-IR is more informative than isolated insulin for several reasons. First, it incorporates glucose: identical insulin of 15 µIU/mL at glucose 4.8 and at glucose 6.2 represent fundamentally different situations. Second, it provides a single numerical scale for longitudinal comparison.
Limitations of HOMA-IR: not applicable in patients receiving insulin therapy (exogenous insulin does not reflect beta-cell secretion); less accurate at very low or very high glucose values. In equivocal cases, more precise methods are used — the hyperinsulinaemic euglycaemic clamp — but these are available only in research centres.
For a complete insulin resistance assessment, HOMA-IR is reviewed alongside HbA1c, which reflects mean glucose over three months and adds information about how long and how stably glycaemic load has been present.
When to See a Doctor
Most cases of elevated insulin are managed electively, but several presentations call for prompt attention.
Urgently:
- Episodes of hypoglycaemia (glucose below 3.5 mmol/L) with simultaneously high insulin — exclude insulinoma; hospitalisation and specialist investigation required
- Undetectable insulin with glucose > 11 mmol/L — probable onset of type 1 diabetes; immediate endocrinologist referral
- Rapidly worsening hypoglycaemic symptoms in a patient on insulin therapy — dose adjustment required
Electively but without delay:
- HOMA-IR > 3.0 with normal glucose — pre-clinical insulin resistance; endocrinologist consultation to develop a correction strategy
- Insulin > 25 µIU/mL fasting without diabetes — significant hyperinsulinaemia requiring investigation
- Weight gain + acanthosis nigricans + menstrual irregularity — insulin resistance screening is mandatory, especially with PCOS
- Family history of type 2 diabetes + obesity + post-meal fatigue — preventive insulin resistance testing
Insulin is one of the few markers whose elevation can be reversed without medication: 7–10% weight loss, restriction of fast carbohydrates and regular physical activity reliably and sustainably reduce HOMA-IR. Early diagnosis of insulin resistance is not a cause for alarm — it is a cause for action. For fasting insulin optimal targets, HOMA-IR calculation and the correction protocol, see the article fasting insulin and HOMA-IR. For how insulin resistance accelerates biological ageing and which other markers reflect this process, see the article ageing of the body: causes and mechanisms. A comprehensive longevity programme and blood test panel is available in the article how to live long and healthy.
This article is for informational purposes only. Interpretation of test results and diagnosis are the responsibility of a qualified physician.
For informational purposes only
This article is for informational purposes only and does not constitute medical advice, diagnosis, or treatment. Please consult a healthcare professional for medical guidance.