Child Growth and Weight by Age: Charts and Percentiles
Reviewed by the LabReadAI medical team
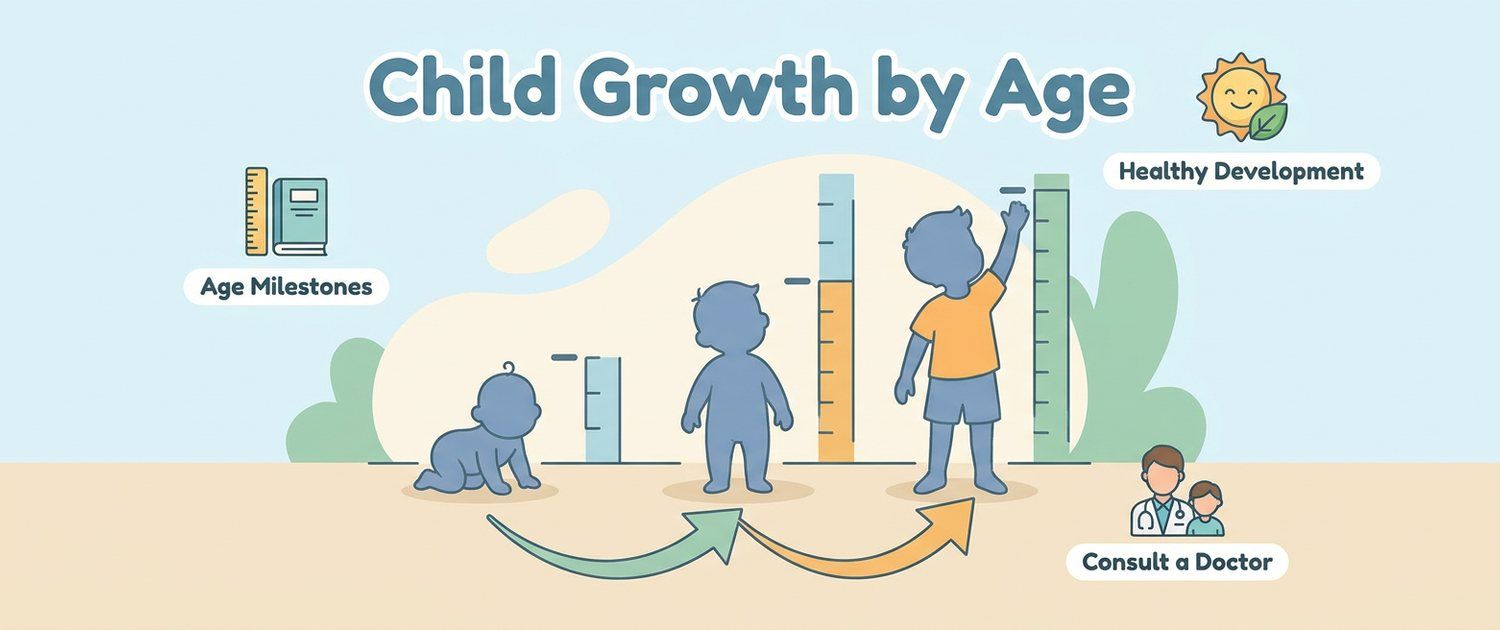
Almost every parent has at some point compared their child with someone else's and drawn a conclusion about health. A paediatrician looks differently: not at one point but at a line. A child steadily tracking just below average for two years is healthy. A child who was above average and slid to the lower boundary in six months needs review — even if formally still "within normal".
Child growth and weight by age: reference charts
The figures below are averages (roughly the 50th percentile). A deviation of 10–15% either way means nothing on its own.
| Age | Boys: height / weight | Girls: height / weight |
|---|---|---|
| Newborn | 50 cm / 3.3 kg | 49 cm / 3.2 kg |
| 3 months | 61 cm / 6.4 kg | 60 cm / 5.8 kg |
| 6 months | 68 cm / 7.9 kg | 66 cm / 7.3 kg |
| 1 year | 76 cm / 9.6 kg | 74 cm / 8.9 kg |
| 2 years | 87 cm / 12.2 kg | 86 cm / 11.5 kg |
| 3 years | 96 cm / 14.3 kg | 95 cm / 13.9 kg |
| 5 years | 110 cm / 18.3 kg | 109 cm / 18.2 kg |
| 7 years | 122 cm / 22.9 kg | 121 cm / 22.4 kg |
| 10 years | 138 cm / 31.2 kg | 138 cm / 31.9 kg |
Rates matter more than absolute numbers: a child gains about 25 cm in the first year, 12 in the second, then 5–6 cm a year until puberty.
Growth percentiles: why they beat average numbers
A percentile shows how many children of the same age and sex are smaller. The 25th percentile means 25% are shorter or lighter and 75% are taller or heavier. Normal spans the 3rd to 97th percentile.
Three practical rules follow:
- Not being on the 50th percentile is normal. Someone has to be on the 10th, and that is not a disease.
- Stability of the channel is what counts. A child holding their 15th percentile is growing normally.
- Crossing channels is the concern. A downward move through two centile channels is a signal even while absolute numbers still look normal.
The ratio is assessed separately: if weight falls before height, nutrition and losses are usually considered; if height slows while weight holds, hormonal causes come first.
Newborn weight gain and the first year
In the first days a baby loses up to 7–10% of body mass — this is physiological. Birth weight is regained by day 10–14; if not, feeding is reviewed.
Then the reference gains are:
| Period | Weight gain |
|---|---|
| 0–3 months | 600–900 g per month |
| 3–6 months | 500–700 g per month |
| 6–9 months | 350–550 g per month |
| 9–12 months | 250–450 g per month |
Useful checkpoints: birth weight doubles by 4–5 months and triples by one year.
How to measure a child's height correctly
Half the "deviations" seen at appointments are measurement errors.
- Under 2 years, measure lying down on a length board, with two people: one holds the head, the other straightens the legs.
- Over 2 years, standing, without shoes, heels together, with the back of the head, shoulder blades, buttocks and heels touching the wall, gaze level.
- Switching from lying to standing produces a 0.5–1 cm difference in favour of the former. That is not a halt in growth.
- Weigh at the same time of day, undressed for infants.
Underweight children and growth faltering
What concerns is the pattern rather than the numbers:
- weight not increasing for two months or more in the first year;
- a downward move through two centile channels;
- height below the 3rd percentile or well below the parental prediction;
- weight falling while height still holds — typical of undernutrition and chronic losses: coeliac disease, persistent diarrhoea, long-standing constipation with reduced appetite;
- height slowing with normal weight — more often endocrine, including hypothyroidism.
In infants, feeding problems sometimes drive poor gain and are read by parents as fussiness and colic — that fork is described in infant colic.
Overweight children and BMI in children
Adult BMI thresholds (25 and 30) do not apply to children: body composition and proportions change with age. Over age 2, BMI for age and sex is used: overweight above the 85th percentile, obesity above the 95th.
In practice the trend matters more: a steady climb across BMI percentiles over a year is a stronger signal than a single high reading. Early action here is about family eating patterns and activity, not diets for the child.
When tests are needed
Growth and weight themselves need no tests — this is a clinical assessment. Investigation follows a departure from the trajectory:
- a complete blood count to exclude anaemia — paediatric ranges are in CBC in children and iron deficiency in iron deficiency anaemia; the key markers are haemoglobin and ferritin;
- a thyroid panel with free T4 when height slows;
- coeliac antibodies when poor gain comes with abdominal complaints;
- vitamin D, calcium and alkaline phosphatase when rickets is suspected, especially with night sweating — see child sweating in sleep.
A scheduled age-appropriate check-up can be assembled as one list by the check-up selector. Tooth eruption timing, often checked against norms as well, is covered in teething in children.
This article is informational. Physical development is assessed by a paediatrician.
For informational purposes only
This article is for informational purposes only and does not constitute medical advice, diagnosis, or treatment. Please consult a healthcare professional for medical guidance.